I’m about to generate Personal Annual Reports for the past few years. Personal Annual Reports is an upcoming trend in the IT and data scene. I want to jump on this trend.
For the graphical representation I’m using gnuplot. To generate and format the data for gnuplot I’m using self-coded Bash, Ruby and PHP scripts. The difference to other folks reports is that mine are not interactive. They are not animated or well formated, only static pictures. But I think the point of Personal Annual Reports are what the data is saying about the person, not what the report itself look like. I’m not a graphics designer so I don’t care what it looks like. I don’t want to spend weeks each year to generate those reports like other people do. I want to generate the reports for all years as automated as possible. It doesn’t need to look like different each year. See the reports of Jehiah Czebotar then you know what I mean.
iOS Text Messages (SMS) and iMessages
Extracting the files from the iPhone backup on my iMac was a tricky one. The files in the backup directory (~/Library/Application Support/MobileSync/Backup) are named with a hash. So for a human it’s impossible to know which file is the wanted one. But there is also a file named Manifest.mbdb[1]. With informations from this database you can rename the files. After the rename process the SQLite database for Texts and iMessages is under HomeDomain/Library/SMS/sms.db. Accessing a SQLite database is very easy and as well as in every programming language possible. The rename/extraction process is also a basis for other databases stored on iPhone. For example of the Call History, discussed below.
Note: Don’t get confused by comparing the Call Detail Records of your Mobile Network Operator with your own processed data of the SQLite database: even if a text message is longer than 160 characters the message is counted as one single message in the iOS database, but not on the Mobile Network Operator side. The same message can have multiple data records in the Call Detail Records. So, to be correct you need to count not only the amount of the messages in the database but also check if a message is longer than 160 chars. In my case the corrected value is about 36 % more.
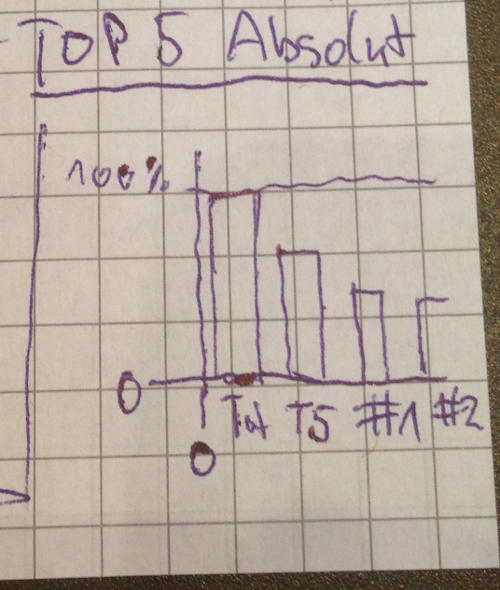
This is what the Texts graph looked like before the correction:

And after:

Calls
The iPhone call history is located under HomeDomain/Library/CallHistoryDB/CallHistory.storedata. Like on the Texts/SMS it’s necessary to extract the files from your iPhone backup with the Manifest.mbdb file first.
Table ZCALLRECORD, field ZCALLTYPE:
- 1 = Normal Call
- 8 = Facetime Call
WhatsApp was easy to export. The database is SQLite. You just need to make an iPhone backup, same process as for iOS Text Messages and iMessages. The file is under
AppDomainGroup-group.net.whatsapp.WhatsApp.shared/ChatStorage.sqlite- or
AppDomain-net.whatsapp.WhatsApp/Documents/ChatStorage.sqlite.
The database under iOS is created by Core Data so the timestamps are in seconds since 01.01.2001. In Ruby:
base_date = Time.new(2001, 1, 1, 0, 0, 0, 0)
Then I add the value from the database and convert it to localtime:
new_date = base_date + row[9]
row[9] = date.localtime.to_s
Skype Messages
Skype conversations are also pretty easy to export. The SQLite database on OS X is under ~/Library/Application Support/Skype/<SKYPE_USERNAME>/main.db.
The timestamps are in Unix Time, localtime. So I don’t need to convert it to another timezone or add a base date. Just converting to a human-readable format:
timestamp = Time.at(row[0])
row[0] = timestamp.to_s
Table Messages, field type:
- 10 = Being added to conversation.
- 61 = Text Messages
Skype Calls
Same database as the Skype Messages.
Table Conversations, field type:
- 1 = Single Conversation
- 2 = Group Conversation
Trello
You can use the Trello API or the cookies from your browser to download the boards in JSON format.
Time Distributions
Time distributions like this below are simpler to generate as you might think. Read Fabian Dill’s blog post about Box Plots to have a better understanding on how to generate such kind of graphs. It’s actually more trickier to understand these graphs.

Sports
Since I’m going swimming I tracked the completed lengths on a daily basis with a simple spreadsheet.
Lunch Break
On many daytime graphs you clearly see the lunchtime break-in around 12pm.

Conclusion
It took me 60 days to generate the scripts for the reports. Maybe I could have been faster to complete the project but my perfectionism sometimes is a pain in the ass.
So finally here are the reports: http://report.fox21.at